ARDUINO based GRAPHS Display System
Published by Fayaz Hasan on 24th Jun 2019
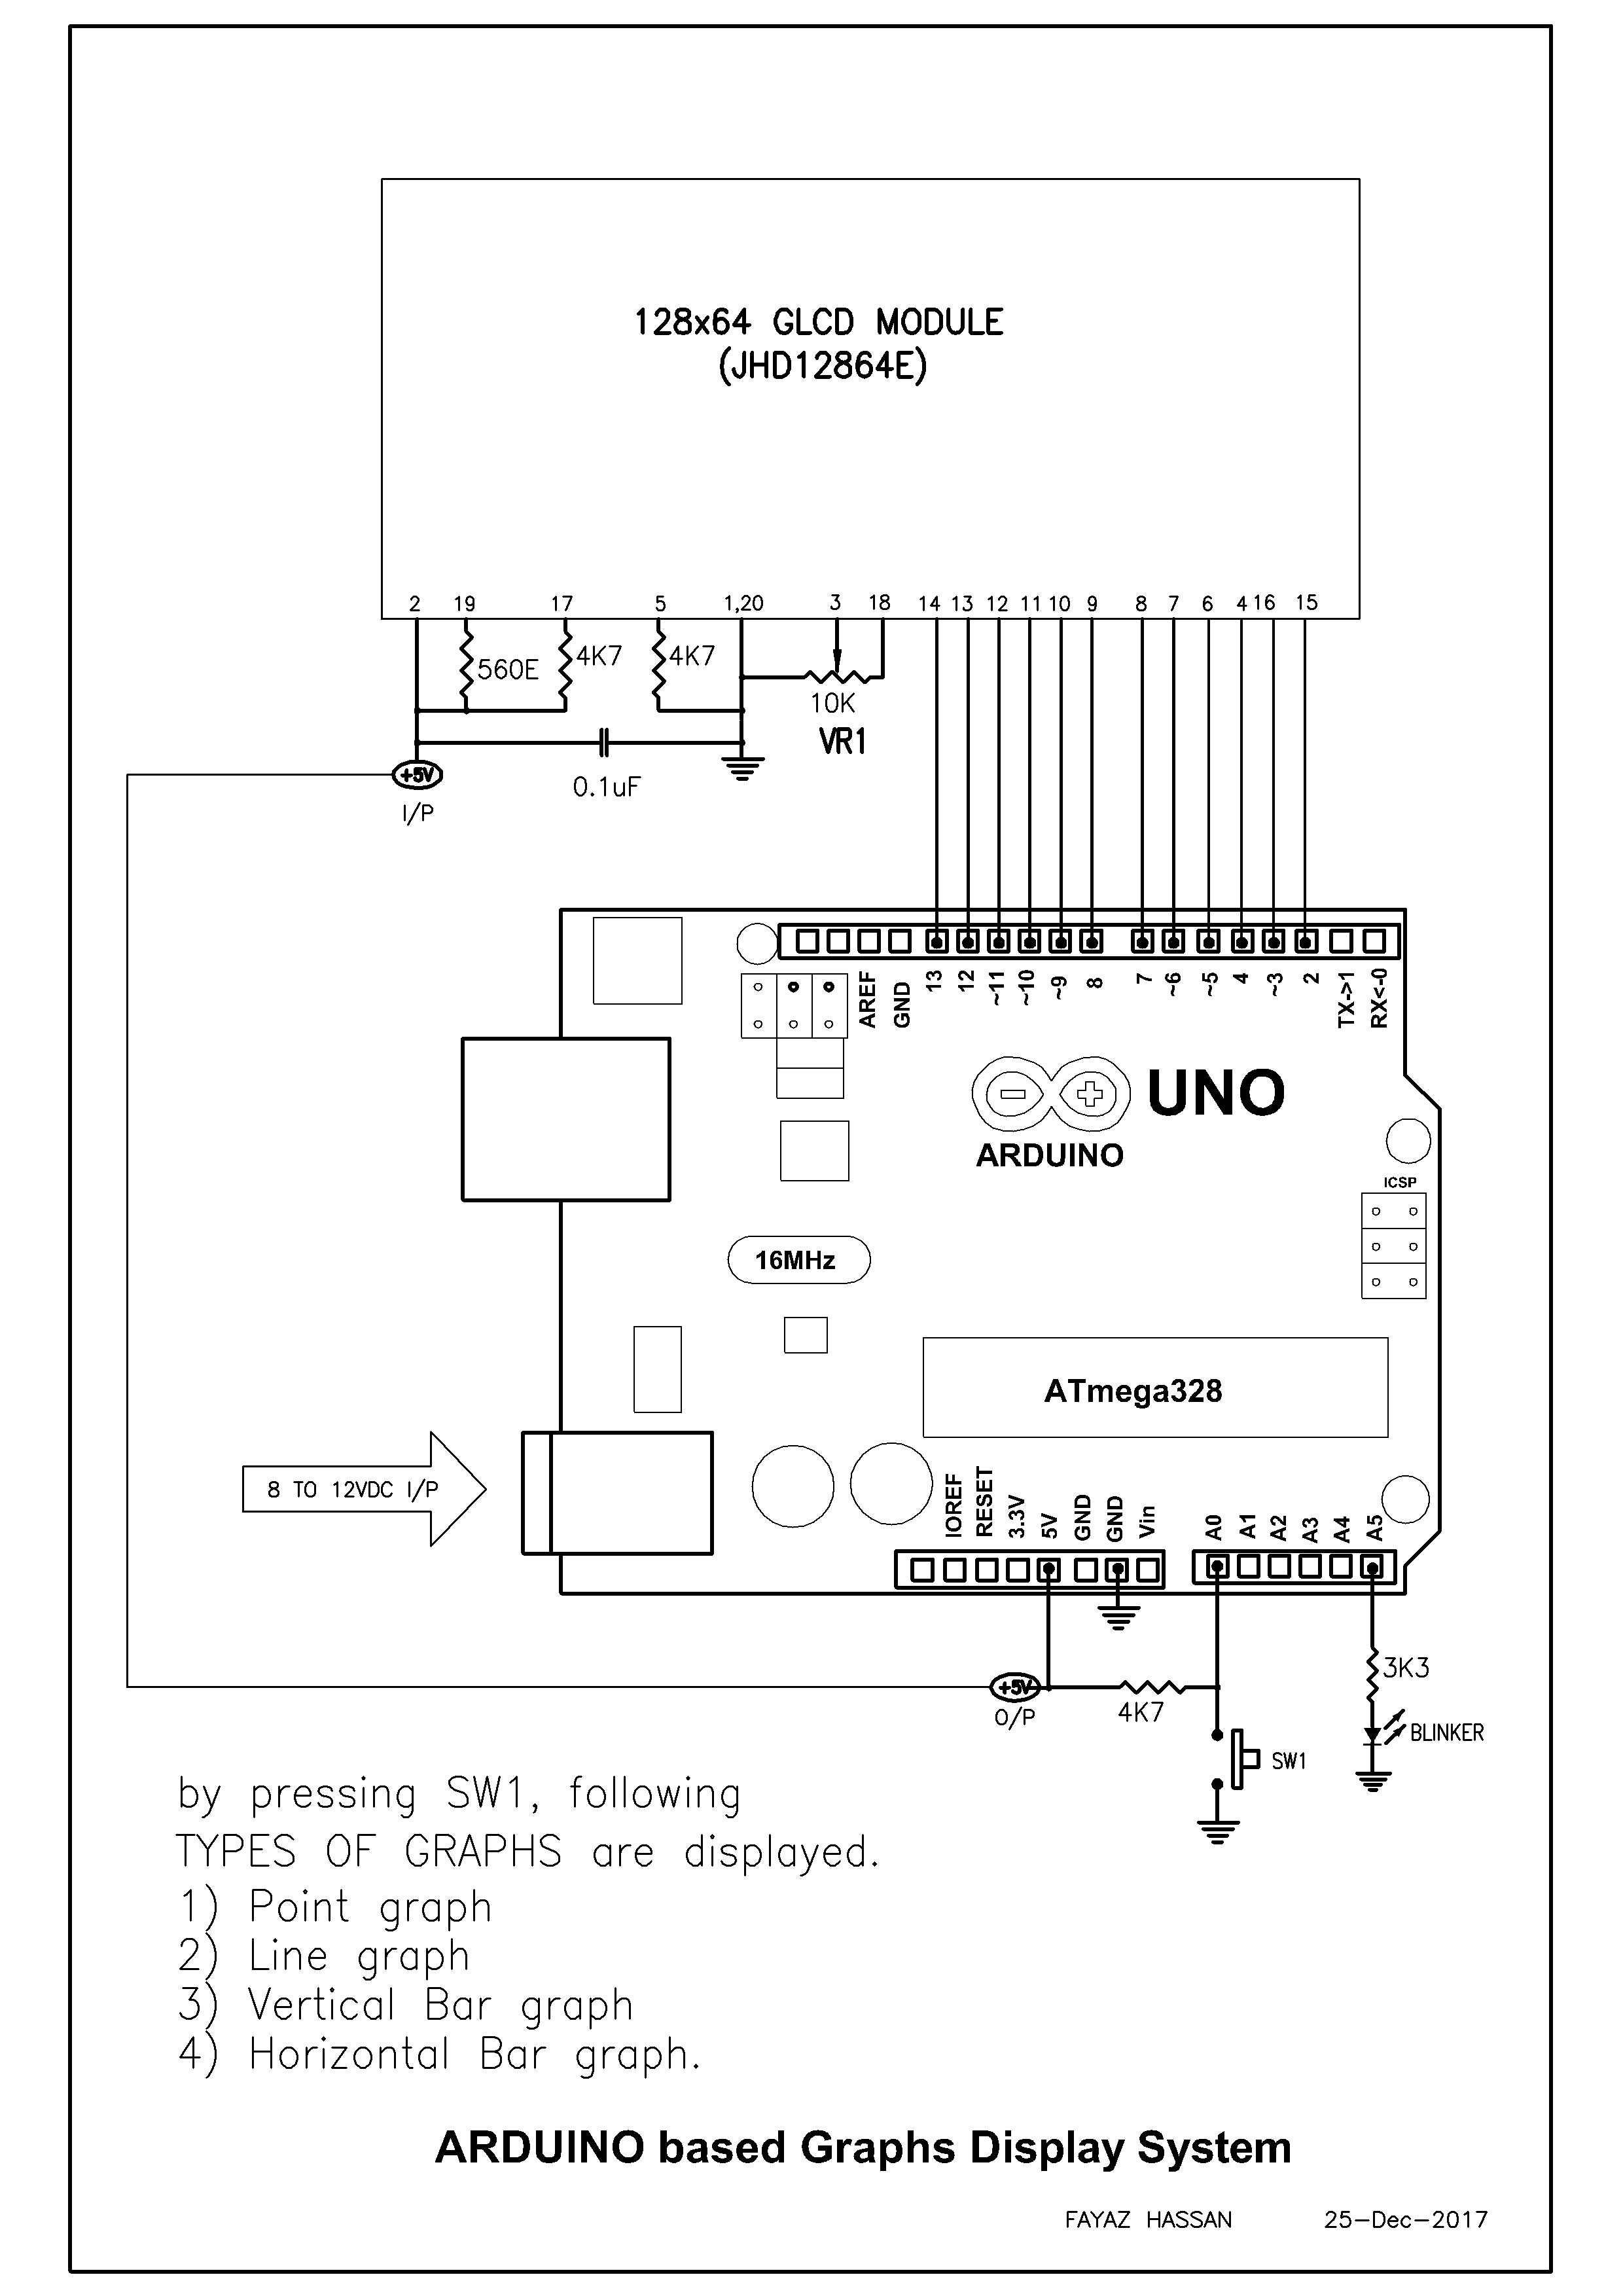
Graph is very easily understandable pictorial form, which is used to display status/statistical condition of a system. The data presented in a graph can be used to inform relative status of progress and trend of the system. The project presented here can display the values in various types (4 types) of graphs. They are,
1)Point (Dot) Graph.
2)Line Graph
3)Vertical Bar Graph
4)Horizontal Bar Graph
The circuit is also very simple and requires very few components. The circuit uses mainly two components, i.e., Arduino board and GLCD screen with some discrete components.
The Arduino board is used to process the data and send proper signal for GLCD screen. A blinker LED indicates the processor loop is working. A switch SW1 is provided to change the type of the graph using same values. The values and labels can be easily changed in the Arduino sketch through Arduino IDE, then compile and upload to Arduino board once again. A DC power supply upto 12V is required for Arduino board. The 5VDC supply from Arduino is used as power supply for GLCD screen. Don’t forget to connect the ground of Arduino and ground of GLCD sceen.
The GLCD (Graphical Liquid Crystal Display) screen used here is 128X64 pixel size. The GLCD screen is divided into two equal halves 64X64 pixels. By changing CS1 and CS2 pins, the left and right parts of the screen is activated to display the data. The data and command is 8 bit length ( 1 byte ) and differentiated by selecting status of RS pin. The code to display a pixel or line is written in the Arduino sketch. By using the routines in the sketch, any project based on GLCD screen can be easily designed and written. VR1 is used to adjust the contrast of GLCD screen.
Initial Setup / Usage:
First, upload the sketch to Arduino board after connecting DC power supply to the board, then disconnect the DC power supply. The GLCD and its connected discrete components should be assembled separately and connect its data and control pins as shown in the circuit diagram.
Now, connect 5VDC power supply to GLCD from Arduino board, then switch ON power supply to Arduino board. The blinker LED should start blinking and GLCD will display a graph. Press SW1, to change type of graph. The four types of graphs will be displayed on the screen.
The working of the project is available at following link: https://youtu.be/YAFez-94TIg .